One of the most interesting aspects of working with companies in the oil and gas industry is how much they change. They are continually innovating to offer new products and services, and this often causes them to open new office locations.
In the old days of building websites, we would have built a beautiful graphic map showing all of the locations. This beautiful map, however, always caused a problem. Because it was so time consuming to update and required the skills of a graphic artist, these changes were delayed or not completed at all. And in turn, the website was never quite accurate. Many companies then turned to text based office lists to avoid this inconsistency. These were accurate, but not so pretty.
Now we can have the best of both worlds - a beautiful graphic map with an easy to use interface that's very easy to update.
One of the best examples of this is Royal Services in Broussard, Louisiana. They provide customized monitoring, communication, and production systems for oil and gas drilling projects, and their business is continually expanding to new locations as you can see from their locations map.
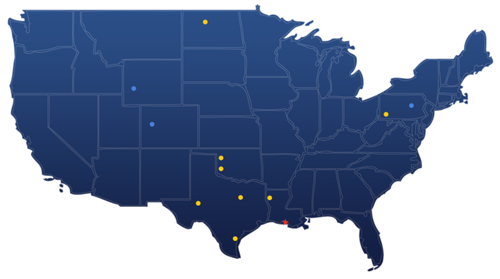
The map shows their headquarters, field offices and partner locations, each identified with a different color icon. The map also displays the office name and phone number when the mouse hovers over each location.
The best part of this map is how easy it is to update it. On the back end of their Business Catalyst website, they have an easy interface that allows them to specify the name, type of office, phone number and GPS longitude and latitude. That's it. Then voila, each location appears on the map.